Time
min
Modeled signal wait saved
Same 90s signal plan. Crossing choices above change this result. Added driver delay is not included.
01 / One continuous possibility
What if Broadway belonged to people walking and cycling, from Bowling Green to Inwood?
Bowling Green → West 220 Street
Scroll into the city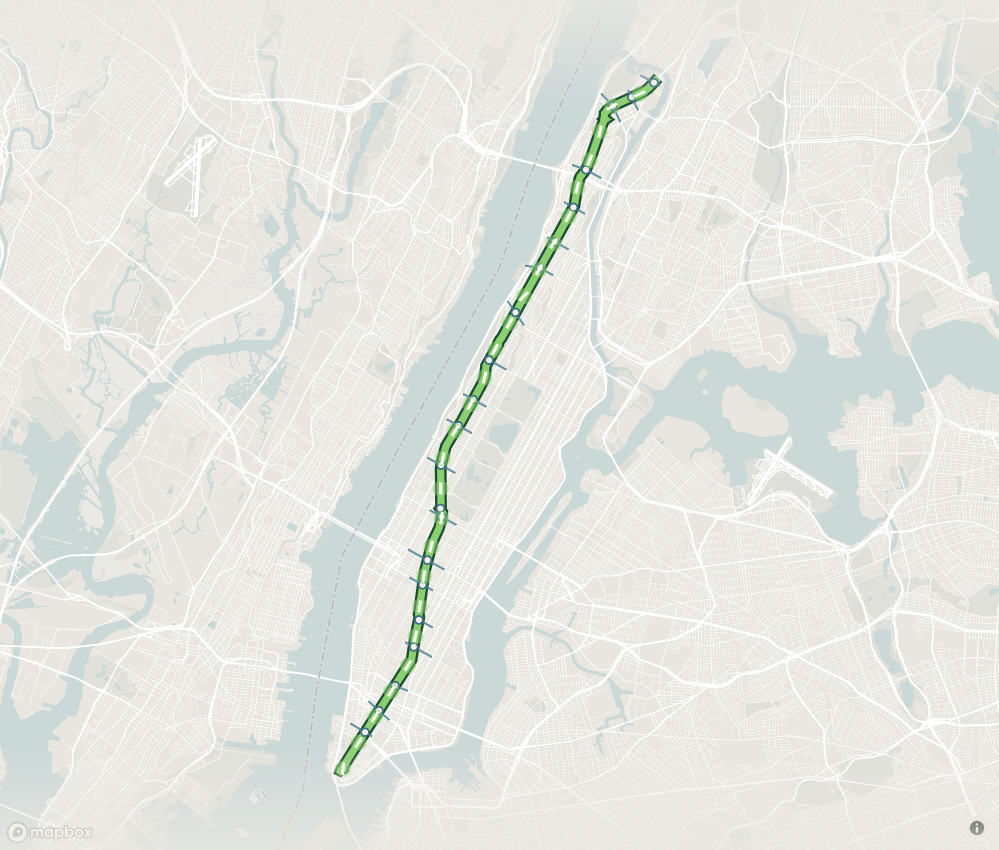
Manhattan / 21.3 km of possibility
02 / The city keeps crossing
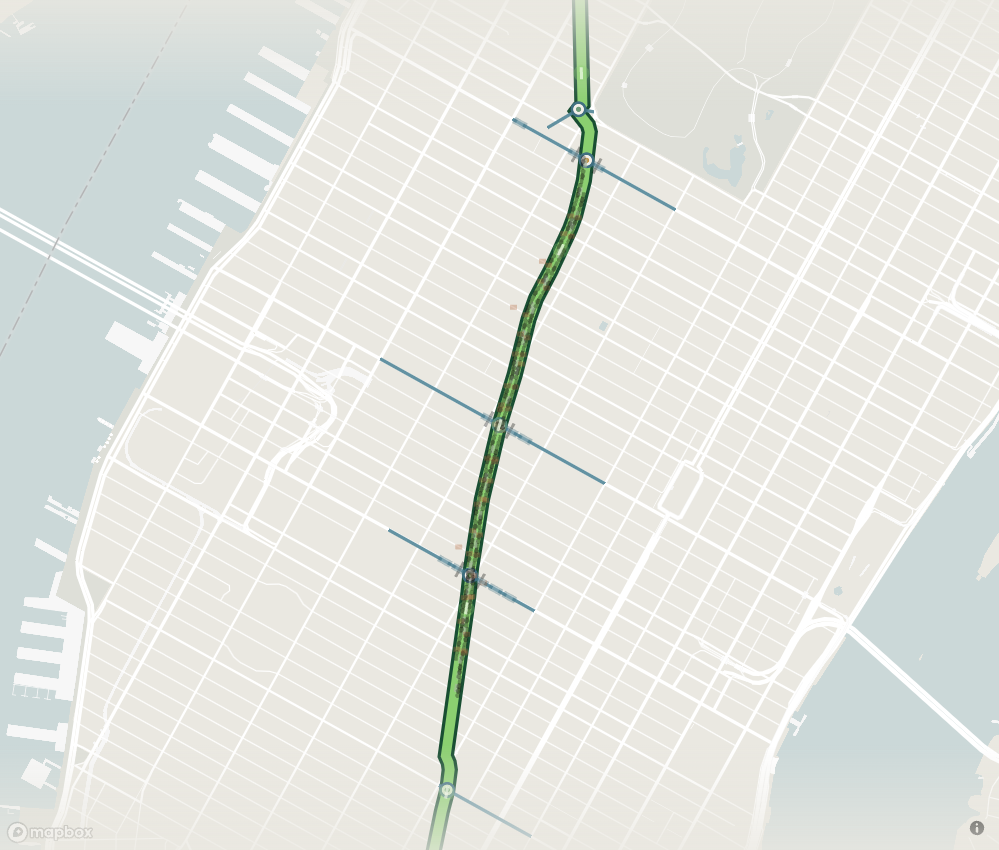
Keep major corridors open. Give walking and cycling a continuous spine.
Change the crossing strategy to see where movement concentrates. Displaced traffic still needs somewhere to go.
21 retained motor crossings
Candidate crossing network. Traffic diversion is not a network congestion forecast.
03 / A single signal cycle
One junction makes the network tradeoff visible.

Scroll or drag time to inspect. 35s motor + 5s clear + 45s Broadway + 5s clear. Walk/cycle entry closes early to clear the road. Illustrative geometry and timing.
04 / The last hundred meters
Follow one delivery across the final block.
One delivery / three stages
Truck → transfer → door
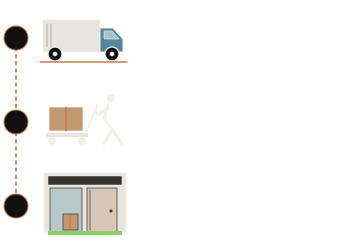
min / one stop + return
05 / The space between buildings
A clear route, a place to pause, and a door that remains reachable.
A continuous, unobstructed walking route reaches every entrance. Deliveries, seating and planting stay outside that clear route.
Illustrative section. Widths, fire access, accessibility and delivery hours require block-by-block design.
06 / North of the easy answer
Buses, hospitals and bridge connections shape whether the route can continue.
DOT’s 2025 study identifies five bus routes and about 30,000 daily riders on the northern corridor.
Before extending north, establish a workable bus-service alternative with MTA and DOT. A line on a map does not replace a bus trip.
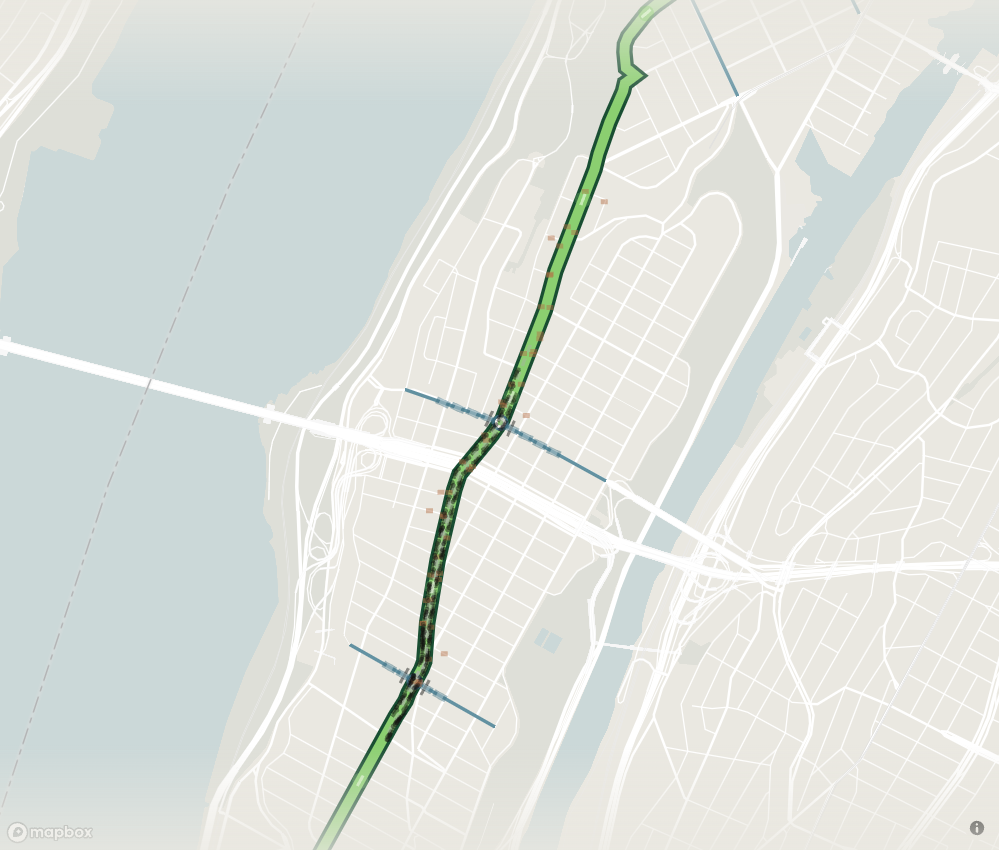
Broadway / bus continuity
07 / Assumptions in, outcomes out
Compare the proposal with the city around it.
Time
Modeled signal wait saved
Same 90s signal plan. Crossing choices above change this result. Added driver delay is not included.
Local spending
Illustrative gross corridor purchases
65M visitors in 2025 × reach × spend. Some purchases could shift from other NYC businesses. Net citywide benefit is unknown.
Tailpipe CO₂
Net change at equal removed and detoured distance
Passenger-car-equivalent tailpipe factor: 400 g/mile. Construction, fleet mix and upstream energy are outside this estimate.
Air on the street
Vehicle distance removed from Broadway
Less exhaust activity on the corridor can reduce local exposure. Detours can move it to neighboring streets.
This is an activity proxy. A concentration or health estimate needs traffic, fleet, street geometry, weather and monitoring. The Times Square evidence cannot be scaled to all Manhattan.
Read the local evidence ↗Scenario calculations / illustrative inputs / observed impacts require field data
08 / The proposal becomes a process
The next section opens when the previous one works.
0–12 months / establish the baseline
Measure travel, loading, bus service and accessible trips. Agree on the crossing and access plan.
Gate / publish a baseline and an operational plan.
Baseline / study the whole corridor
Scroll through five windows. Illustrative sequence after a hypothetical authorization, subject to funding and decision gates.
A proposal with its assumptions attached
This is an architectural and operational scenario for Broadway, from Bowling Green to the Manhattan end of the Broadway Bridge. Crossings, bus continuity, accessible trips, emergency response and business deliveries remain design conditions.
The map uses NYC Planning LION geometry and OpenStreetMap signal tags. Signal cycles, offsets and demand are assumed. The moving dots illustrate the model; they are not live traffic counts. Existing pedestrian plazas and local street rules are not fully represented by the comparison.
The calculations expose arithmetic sensitivities. They do not establish a traffic forecast, a benefit-cost ratio, a business revenue forecast or an air-quality prediction.
By John Hilmes · Excelsior, Chapter 01 · October 2026